

AnGo Scroll Analytics
How Far Do People Actually Read Your Articles? We Checked and Were Surprised
You spent hours writing an article. You crafted the headline. Added images. Built an FAQ section. Addressed objections. Placed a call-to-action near the bottom of the page. Now ask yourself one uncomfortable question.
Are visitors actually reaching that part of the page?
Most website owners look at page views. Some also monitor average time on page or bounce rate. But none of those metrics answer the most important question:
How much of your content do people actually read?
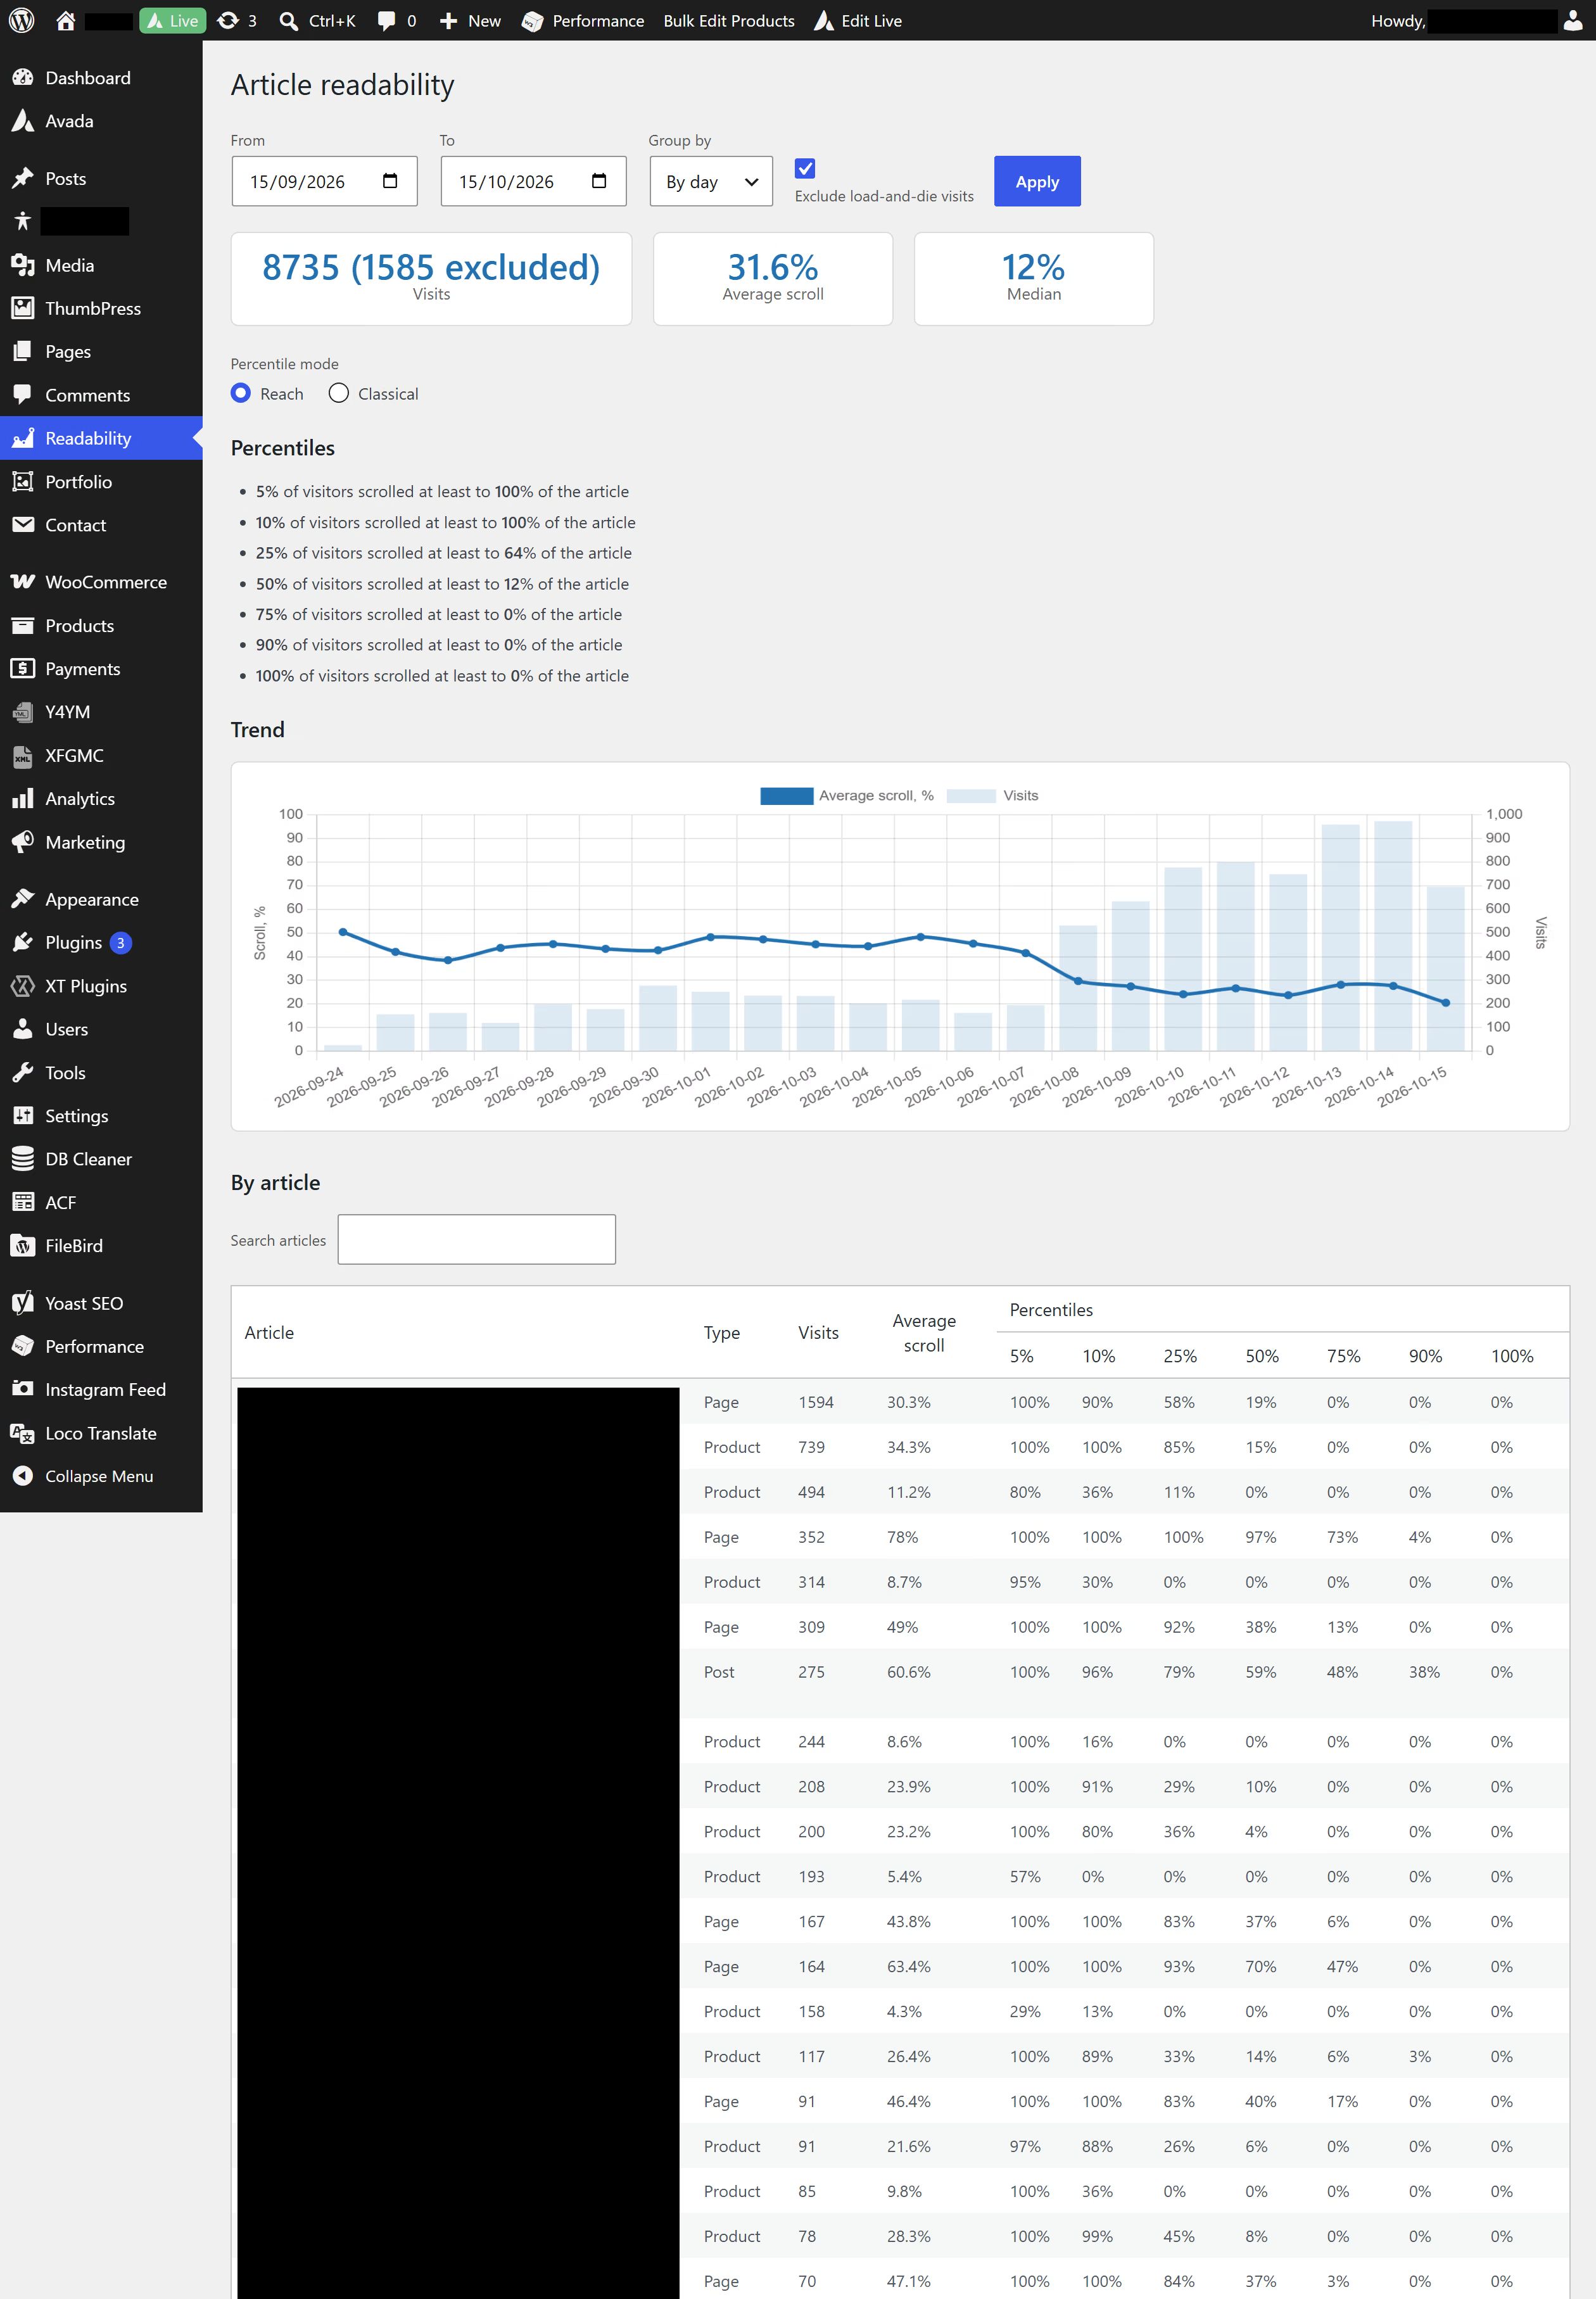
When we started analyzing reading behavior on our own websites, the results were surprising. On many pages, half of the audience abandoned the article after reading only the first 10–15% of the content. Visitors never reached the most important arguments, customer testimonials, product comparisons, or call-to-action sections. That’s why we built a free WordPress plugin. It contains no ads, does not send data to third parties, and helps answer one simple question:
How deeply do visitors read each page on your website?
Why Traditional Analytics Is Not Enough
Imagine two articles. Both have an average scroll depth of 30%. At first glance, the performance looks identical. In reality, the audience behavior could be completely different.
Article #1 — Most visitors read about one-third of the content and then leave.
Article #2 — 90% of visitors leave almost immediately, while the remaining 10% read the entire article.
The average scroll depth might look similar. The audience engagement is completely different. That’s why we introduced percentiles. Instead of showing a single average number, percentiles reveal the actual distribution of readers across your content.
Two Ways to Look at the Same Audience
The plugin provides two analysis modes.
Reach
Answers the question: How far did the most engaged readers get? This mode is useful when you want to measure visitor engagement.
Classical
Answers the question: Where is the majority of the audience, and where do readers drop off? This mode is useful for identifying problem areas within an article.
These are simply two different ways of looking at the same data.
Example: Reach Percentiles
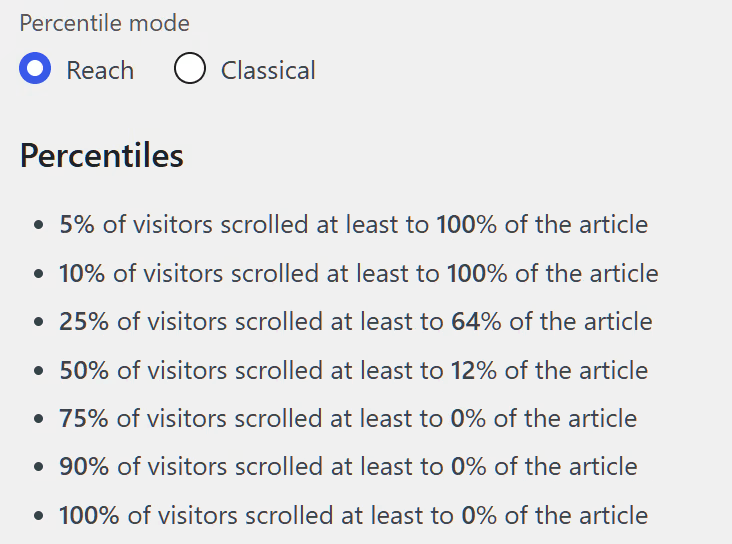
Suppose the plugin reports the following values:
5% → 100% — At least 5% of visitors read the entire article. This is an excellent engagement signal.
10% → 100% — At least 10% of visitors reached the end of the article. Another strong result.
25% → 64% — At least one-quarter of your audience reached 64% of the article. This means that only one in four readers makes it through at least two-thirds of the content.
50% → 12% — At least half of your visitors reached only 12% of the article. This is a serious warning sign. The typical reader is leaving almost immediately after starting the article.
Conclusion
Although a small group of highly engaged readers finishes the article, most of the audience drops off within the first few paragraphs.
Things worth checking:
- Does the content match the promise made in the headline?
- Is the introduction too long?
- Is the main value buried too deep in the article?
- Are there distracting elements near the top of the page?
Example: Classical Percentiles
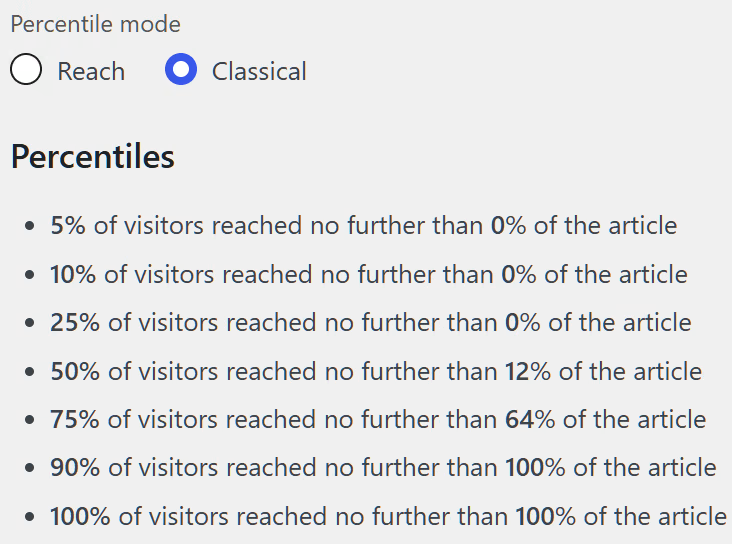
Now let’s view the same data from a different perspective.
5% → 0% — 5% of visitors did not scroll at all.
10% → 0% — 10% of visitors never made a single scroll.
25% → 0% — One-quarter of your audience never started reading the content. At all.
50% → 12% — Half of your visitors reached only 12% of the article or less. This is a strong indication of poor reader retention.
75% → 64% — 75% of visitors did not make it beyond 64% of the article. Only one-quarter of readers managed to go further.
Conclusion
The largest problem occurs near the beginning of the article. One-quarter of visitors leave almost immediately, and half of the audience drops off after reading only 12% of the content.
Why We Show Both Modes
Reach and Classical percentiles do not contradict each other. They describe the same audience from different angles.
For example:
Reach P25 = 64% and Classical P75 = 64% represent the exact same point in the distribution. Reach focuses on your best readers. Classical focuses on the audience as a whole. Both perspectives are valuable.
What This Gives Website Owners
After installing the plugin, you’ll quickly discover:
- articles that readers actually finish;
- pages where visitors leave almost immediately;
- content with strong headlines but weak introductions;
- long articles that nobody reads to the end;
- pages where the call-to-action is placed too far down.
Many website owners assume they have a traffic problem. In reality, they have an engagement problem. Visitors arrive, but leave before seeing the most important content. Reading-depth analytics helps uncover that problem in minutes.
Try It on Your Own Website
Install the AnGo Scroll Analytics plugin and analyze a few of your most popular pages.
You may discover that only a small percentage of visitors ever reach:
- your contact form;
- your benefits section;
- your product comparison table;
- your purchase button;
- your final call-to-action.
Those discoveries often lead to some of the easiest conversion improvements you can make without spending more on advertising. Because sometimes the problem is not getting visitors to your website. The problem is keeping them engaged once they arrive.
Need Help Understanding Your Results?
Install the plugin and collect the data. If you need help interpreting the results, just get in touch.
We can review your website’s reading-depth data, identify where visitors lose interest, and provide clear conclusions and practical recommendations tailored to your content.
Instead of leaving you with charts and numbers, we’ll help you understand:
- which pages keep visitors engaged;
- where readers tend to drop off;
- which introductions or content sections may need improvement;
- whether important calls to action are placed too far down the page;
- what you can change to improve reader retention and conversion opportunities.
You’ll receive more than a collection of metrics. You’ll receive understandable conclusions and a practical list of improvements for your website.







No Fluff, Just Solutions
Have a digital challenge for us? We’re listening. Reach out today, and let’s build a solution that actually performs.